
Fast Horse Racing Results Today: Live Updates and Starting Prices
Fast horse racing results today arrive within seconds of every finish, not minutes. That distinction matters when you have money riding on the outcome, when you are tracking multiple meetings across British racecourses, or when you simply want to know whether your fancy justified the faith you placed in it before the off. The punter checking their mobile at Cheltenham, the office worker glancing at live updates during lunch, the armchair enthusiast following Saturday's feature card—all depend on results infrastructure that has been refined over decades to deliver accurate, verifiable data at genuine speed.

What British Punters Must Know About Live Horse Racing Results
- Results arrive within seconds of each finish through BHA-coordinated infrastructure spanning 59 racecourses and 1,410 annual fixtures.
- Starting prices settle bets worth £766.7 million in annual gross gaming yield—understanding SP means understanding how your returns are calculated.
- The industry behind results employs 85,000 people and generates £4 billion in economic value, with £109 million in levy funding supporting prize money and welfare.
- Scheduling improvements have cut race clashes from 11.1% to 5.8%, meaning faster result updates and fewer bottlenecks on busy cards.
- Jump and flat racing generate distinct result types—13,556 horses in training produce outcomes requiring context-specific interpretation.
How Racing Results Work

Behind every result that appears on your screen sits an infrastructure built from decades of refinement. The British Horseracing Authority oversees this architecture, but execution involves racecourse officials, timing equipment, photo finish technology, and data feeds that transmit outcomes to betting platforms, media outlets, and punters within moments of horses crossing the line.
The process begins before the race. Declarations close at various stages depending on the type of fixture, with final runner confirmations establishing the field. Overnight markets take shape, early prices emerge, and by the time runners approach the start, the betting exchanges and traditional bookmakers have processed thousands of transactions. When the starter releases the field, everything that follows generates data: positions at various stages, sectional times at courses equipped to record them, and ultimately the order in which runners pass the finishing post.
Photo finish cameras have been standard at British racecourses for decades. These mirror-based systems capture a continuous image of the finish line, producing the distinctive strip photographs that judge officials examine when margins prove too close for the naked eye. Modern equipment records at extraordinarily fine resolutions, capable of separating runners by fractions that would have been called dead heats in earlier eras. The technology removes ambiguity, though interpretation still requires trained eyes—hence the continued role of the judge, an official whose declaration of the result carries legal weight.
Timing systems complement the photo finish. Electronic beam technology records the moment each runner breaks the plane, generating official times that appear alongside results. These times matter for form students attempting to compare performances across different meetings or even different seasons. A horse winning in a fast time at Newmarket tells a different story from one grinding out victory on heavy ground at Haydock, and the official clock provides the baseline for such comparisons.
What has changed most dramatically in recent years is the distribution layer. Results once moved from racecourse to betting shop via teleprinter, then via satellite feeds, and now through internet protocols that deliver data to apps before bookmakers have finished paying out trackside. The BHA's push to reduce scheduling clashes directly supports this speed. When races are spread sensibly across the day rather than bunched into overlapping time slots, each result receives individual attention from broadcast partners and data providers. The reduction of clashes before 5pm from 11.1% in 2022 to 5.8% in 2024 represents a deliberate structural improvement with tangible benefits for anyone tracking live results.
The personnel involved extend beyond the course itself. Stipendiary stewards monitor proceedings for compliance with racing's rules. The judge announces the official result. Handicappers later assess performances to adjust ratings. Betting industry operators receive feeds that update their platforms. Each participant in this chain handles data with urgency, because delays erode confidence and frustrated customers move to platforms that deliver faster.
Integrity services form another layer. Racing operates under scrutiny precisely because money changes hands on outcomes. The Authority maintains a dedicated Intelligence department that monitors betting patterns, investigates suspicious activity, and takes action when evidence suggests manipulation. Results released quickly are also results released under observation, with unusual market movements flagged for examination even as winning punters queue to collect.
Weather introduces complications. Abandoned meetings, going changes announced after inspection, and delayed starts all affect results availability. Courses conduct inspections at scheduled intervals when conditions prove marginal, and racecourse clerks update the official going description as necessary. These factors mean results occasionally arrive with caveats—races run on different ground from what was expected, or meetings curtailed partway through cards when conditions deteriorate.
The coordinated effort produces something remarkably reliable for an outdoor sport subject to the British climate's whims. Results appear quickly, appear accurately, and appear with sufficient detail to support meaningful analysis. The flat season brings its rhythms, the jumps calendar brings its own, and year-round all-weather racing ensures fixtures continue regardless of what turf conditions permit. Through it all, results flow to the punting public with consistency that reflects genuine infrastructure investment rather than happy accident.
Types of Racing Results
That infrastructure serves two fundamentally different codes, each generating results with distinct characteristics. British racing divides into flat and jump categories, and results from each carry different information because the disciplines ask different questions of their participants. Understanding what you are looking at when results appear means appreciating these distinctions, not as arbitrary classifications but as reflections of genuinely different sporting tests.
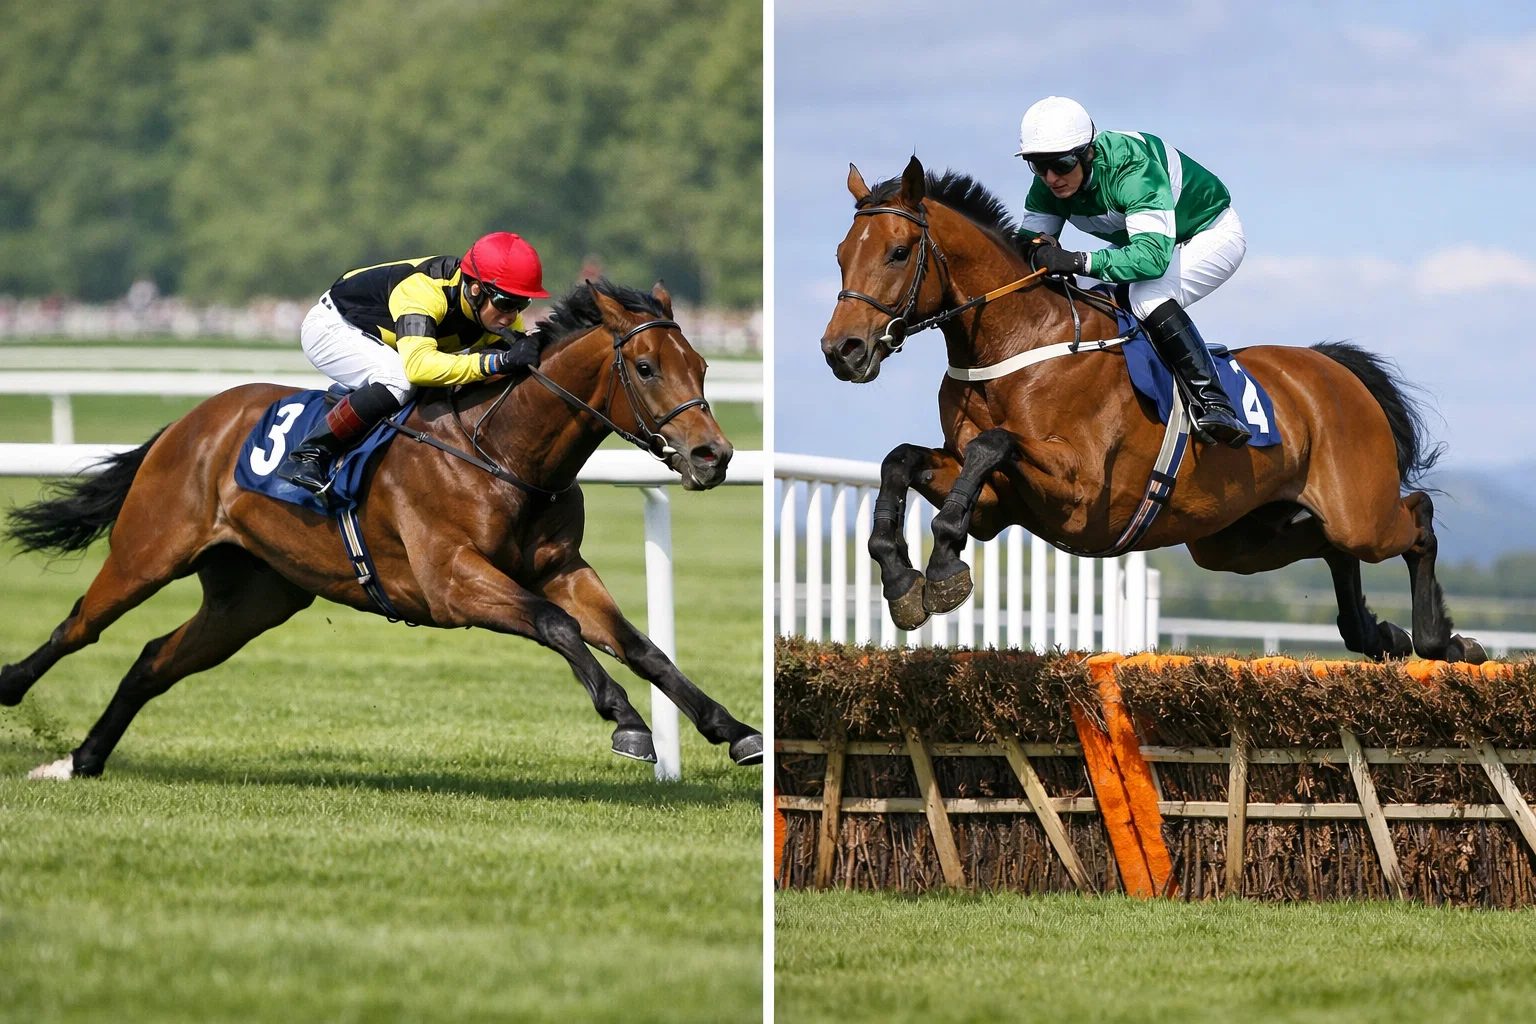
Flat racing operates primarily from April through November on turf, with all-weather surfaces extending the calendar year-round at tracks like Lingfield, Wolverhampton, Newcastle, Chelmsford, and Southwell. With the 2026 turf season now underway, flat racing dominates the spring fixture list. According to the BHA Horse Population Report, 9,561 flat horses were in training in June 2024, representing the larger of British racing's two codes. Flat results record distances from five furlongs to two miles and beyond, though most races cluster between six furlongs and a mile and a half. Starting prices, winning margins, and official times appear alongside the finishing order.
Jump racing—National Hunt—runs principally from October through April, though summer jumping at venues like Newton Abbot and Cartmel maintains the code during turf flat's prime months. Jump results distinguish between hurdle races and steeplechases. Hurdles stand at least 3 feet 6 inches high and must number at least eight in races of two miles or more. Fences for chases stand higher and more substantially, testing a different set of skills. The same BHA report records 3,482 jump horses in training, a figure that has grown 14.6% since 2019—bucking the slight decline in flat numbers over the same period.
Research from the Royal Veterinary College indicates that approximately 35% of all British races fall under the jump category. This proportion holds significant implications for results watchers: on any given winter Saturday, most of the results you track will feature horses negotiating obstacles, and understanding what constitutes a good performance over fences differs from evaluating flat racing speed.
Each result type contains specific data points. Flat results typically include draw position—where the horse started across the course width—because certain tracks exhibit bias favouring high or low stall numbers. Jump results instead focus on jumping errors, whether a horse made mistakes at obstacles that cost ground or fluency. Falls and unseated riders appear in jump results with depressing regularity at certain times of year, while flat racing's dangers manifest differently, primarily through injuries rather than jumping incidents.
Class structure overlays both codes. Group races represent flat racing's elite, numbered 1 through 3 in descending order of prestige. Grade 1, 2, and 3 classifications apply to jump racing's top events. Below these sit Listed races, then handicaps and conditions events descending through Classes 1 to 7. Results carry more weight when achieved in higher company, and ratings assigned after each race reflect this tiered approach to evaluation.
Age restrictions complicate matters further. Two-year-olds run exclusively on the flat, their results watched closely by those seeking Classic contenders for the following season. Jump horses typically reach their peak later, with many chasers not hitting their stride until age seven or beyond. Results therefore require age-contextual reading: a narrow defeat by a three-year-old to older horses carries different implications from the same margin suffered by a mature performer.
What unites both codes is the core result structure: finishing position, starting price, winning margin expressed in lengths, and official time where available. Supplementary information varies by platform, but these fundamentals remain constant across flat and jump, turf and all-weather, maiden and Group 1. Master the basics, and you can read any British racing result with confidence.
Starting Prices Decoded
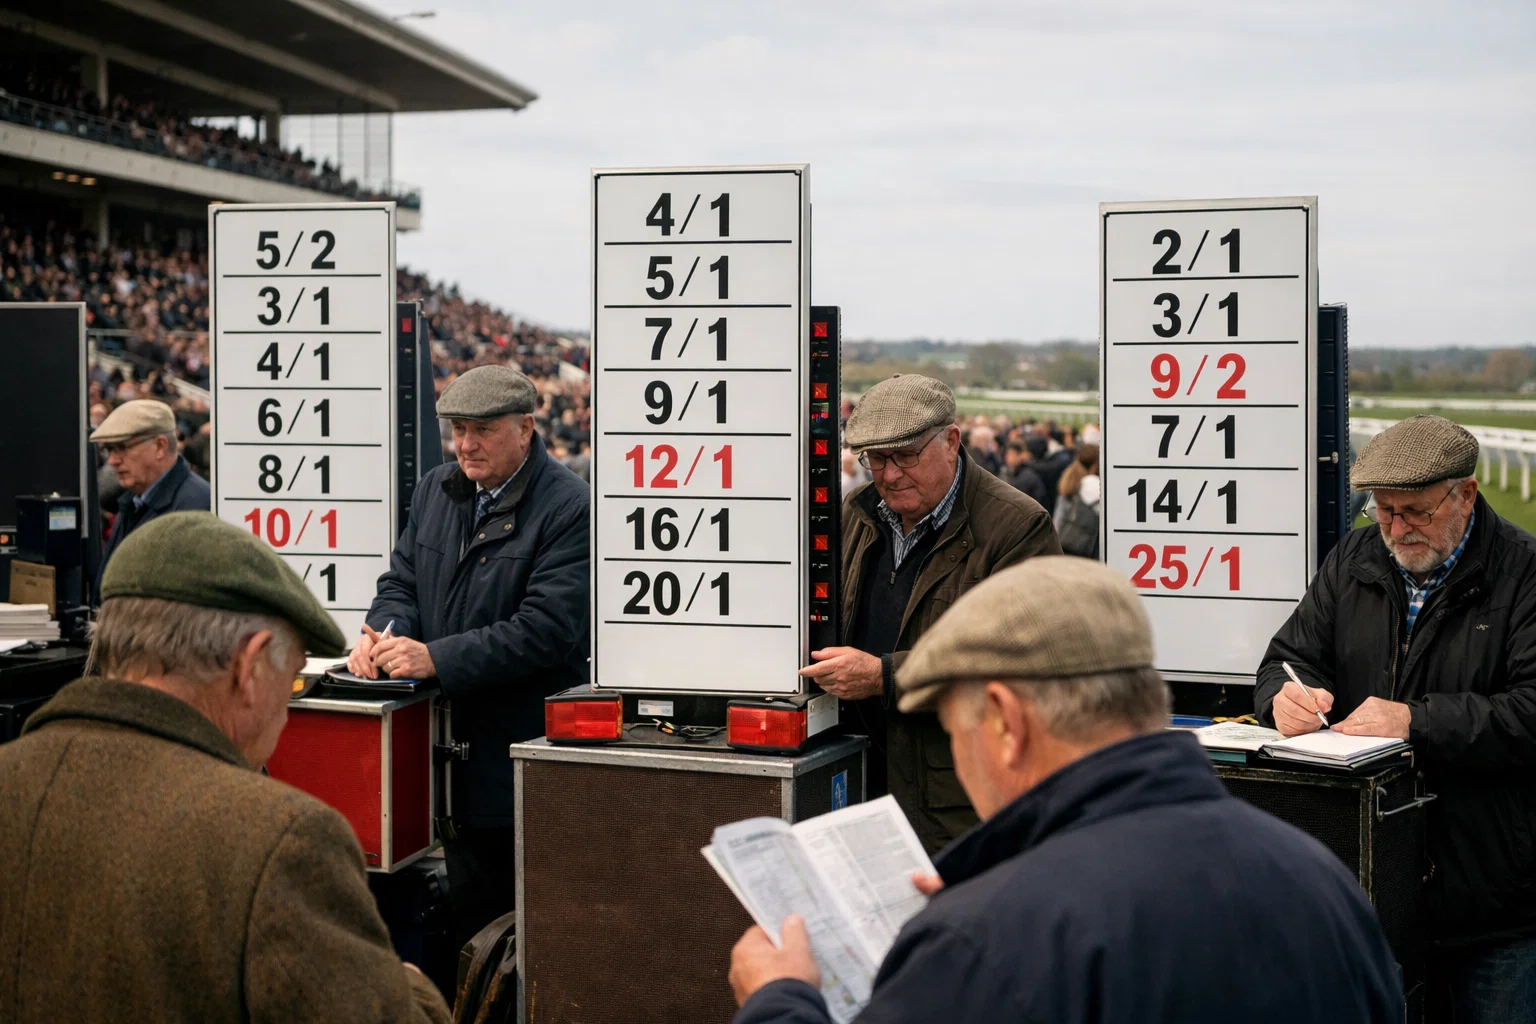
Starting prices represent the official odds at which a horse began a race, determined by on-course bookmakers in the moments before the start. When results appear, SP figures appear alongside—the number that settles bets placed without specified fixed odds, and the benchmark against which all other prices are measured. Understanding SP means understanding how British racing's betting ecosystem functions at its most fundamental level.
The mechanism involves designated reporters watching bookmakers' boards as the field approaches the start. These officials identify the consensus price—the odds most commonly offered by the ring of on-course layers. When the starter releases the field, that consensus becomes the official starting price. Horses that attracted heavy support drift shorter; those ignored by punters drift longer. SP captures the market's final judgement on each runner's chances.
This matters because horse racing betting generates substantial economic activity. According to the Gambling Commission, remote betting on horse racing produced gross gaming yield of £766.7 million in the year to March 2025—second only to football among British sports. Approximately 7% of British adults report betting on horse racing within any four-week period, per the Commission's gambling survey. Each of these bets ultimately settles based on either fixed odds taken in advance or starting price at the off.
Fixed odds versus SP presents punters with a recurring decision. Take a price early, and you lock in value if you correctly anticipate market moves—but risk watching your selection drift to a better price before the race. Take SP, and you accept whatever the market decides, removing timing from the equation but potentially surrendering value to late support. Professionals typically take fixed odds when they hold opinions the market has not yet incorporated; recreational punters often default to SP for convenience.
Betfair SP operates differently, derived from the betting exchange's matched and unmatched orders at the start rather than from on-course bookmakers. This alternative starting price frequently differs from traditional SP, sometimes significantly. Results platforms may display both figures, allowing comparison between traditional bookmaking markets and exchange-based pricing.
Reading SP in results requires understanding fractional notation. A price of 5/1 means a successful pound stake returns five pounds profit plus the original stake—six pounds total. Shorter prices like 4/5 indicate favourites, where you stake five pounds to win four. Decimal odds, increasingly common on digital platforms, express the same information differently: 6.0 corresponds to 5/1, and 1.8 corresponds to 4/5. Converting between formats becomes second nature with practice.
Levy income—the statutory contribution from bookmakers to racing—depends partly on turnover and partly on gross win. Alan Delmonte, CEO of the Horserace Betting Levy Board, noted that levy yield reached almost £109 million in the year to March 2025, the fourth successive year of increase. "There remains a confluence of factors that can be considered as contributors to gross win rising while turnover is falling," he observed in the HBLB Annual Report. Risk-based checks on high-staking customers have altered betting patterns, shifting the relationship between turnover and yield in ways that affect how SP settles for different segments of the market.
Joint and co-favourites appear when two or more horses share the shortest price. Results display these situations accordingly, sometimes affecting returns when rules about dead-heats or favourite settlement apply. Industry-standard rules determine how bets pay out when multiple horses start at identical odds—typically reducing returns proportionally.
SP remains racing's universal pricing language despite the proliferation of fixed-odds comparison tools and exchange alternatives. Results without SP would be incomplete, lacking the anchor that connects performance to market expectation. When a 20/1 outsider wins, the SP communicates surprise; when a 4/6 favourite delivers, it records inevitability. These numbers transform bare finishing positions into narratives about expectation, judgement, and occasionally, delightful upset.
Tote Dividends Basics
Pool betting operates on different principles from traditional bookmaking. When you place a tote bet, your stake enters a pool alongside other punters' money on the same race and bet type. The total pool, minus the operator's deduction, then divides among winning ticket holders. Returns depend not on fixed odds set before the race but on how much money backed each selection—and crucially, how much backed the winner.
The Tote, now operated by UK Tote Group under a seven-year exclusive licence beginning in 2021, offers several pool bet types. The Win pool is simplest: back a horse to finish first, and if it obliges, you share the pool with others who made the same selection. The Place pool covers horses finishing in the places, with the number of places paid depending on field size and race type. Exacta requires predicting first and second in correct order. Trifecta extends this to the first three. Placepot covers the first six races on a card, requiring a placed horse in each.
Results display tote dividends alongside starting prices, typically expressed to a £1 stake. A Win dividend of £4.50 means a pound stake returned four pounds fifty including the original stake—equivalent to fixed odds of 7/2 in traditional bookmaking terms. Place dividends appear separately, often representing modest returns on shorter-priced selections but occasionally offering value when an outsider fills a minor position.
The absence of predetermined odds creates distinctive dynamics. Late money on a horse shortens tote returns for those who backed it earlier, because more people share the pool. Conversely, lightly-backed winners can produce dividends exceeding SP by considerable margins. Professional tote punters study pool distribution, seeking situations where value exists relative to bookmaker prices—an approach requiring information not always readily available to casual punters.
Exotic bets like the Placepot generate considerable interest, particularly at major meetings. Accumulating six placed selections produces rollovers when no punter succeeds, leading to occasional jackpot dividends that attract widespread attention. Results from Placepot meetings indicate both winning dividends and consolation payments for those who found five or four of the six selections.
Understanding tote returns means accepting less control over price but gaining access to bet types unavailable through fixed-odds bookmakers. The Scoop6, Super7, and various combination bets offer lottery-like potential from racing outcomes. Results record these dividends alongside more conventional figures, creating a complete picture of how different bet types settled.
Minimum stakes apply to pool bets, typically lower than exchange minimum transactions but potentially higher than some bookmaker minimums. The economics work differently: bookmakers profit from their margin over true probability, while pool operators deduct fixed percentages regardless of outcomes. Both models coexist within British racing's betting landscape, and results reflect both systems' outputs when dividends and SP appear together.
British Racecourses Overview
Every result you track originates from one of Britain's 59 licensed racecourses, a network unmatched in density by any comparable nation. From Ascot's royal prestige to Cartmel's intimate charm, from Newmarket's historical primacy to Newcastle's floodlit all-weather circuit, each venue contributes distinctive character to the results you track. Understanding where results originate helps interpret what they mean.
The Racecourse Association reported 1,410 fixtures completed across these venues in 2024, a modest reduction from 1,425 the previous year. These meetings distributed unevenly: certain courses like Wolverhampton and Southwell host year-round all-weather cards, staging dozens of meetings annually. Others, like Epsom, concentrate activity around major festivals while hosting relatively few standalone fixtures. The pattern shapes where results originate on any given day.
Flat-only courses include Ascot, Newmarket, Epsom, Goodwood, and York—venues that stage British racing's most prestigious turf events but close when ground conditions or calendar dictate. Jump-only venues like Fontwell, Plumpton, and Sedgefield specialise in National Hunt racing, their courses designed around obstacles rather than flat speed. Dual-purpose tracks manage both codes, switching between flat and jump according to season and fixture allocation.
All-weather surfaces transformed British racing's calendar. Lingfield, Wolverhampton, Newcastle, Chelmsford, and Southwell offer synthetic surfaces impervious to the frost and waterlogging that abandon turf meetings. Polytrack at Lingfield and Chelmsford, Tapeta at Wolverhampton and Newcastle, and Fibresand at Southwell each produce subtly different characteristics. Results from these surfaces demand recognition that form may not translate directly to turf—though exceptions exist, particularly among horses with proven versatility.
Course configuration affects how results should be read. Newmarket operates two distinct courses: the Rowley Mile for spring and autumn, the July Course for summer. Chester's tight circuit favours horses that handle bends; Epsom's unique downhill camber demands specific balance and attitude. Results annotate which course within a track hosted each race, because past form on one configuration may not apply to another.
Geography matters for scheduling purposes. Scottish courses like Ayr, Hamilton, Musselburgh, and Perth draw different populations of horses from their southern equivalents, with runners sometimes travelling considerable distances for opportunities suited to their profiles. Northern meetings frequently clash with southern fixtures, creating afternoon cards where results split attention across the country. Regional rivalry persists through patterns established over centuries.
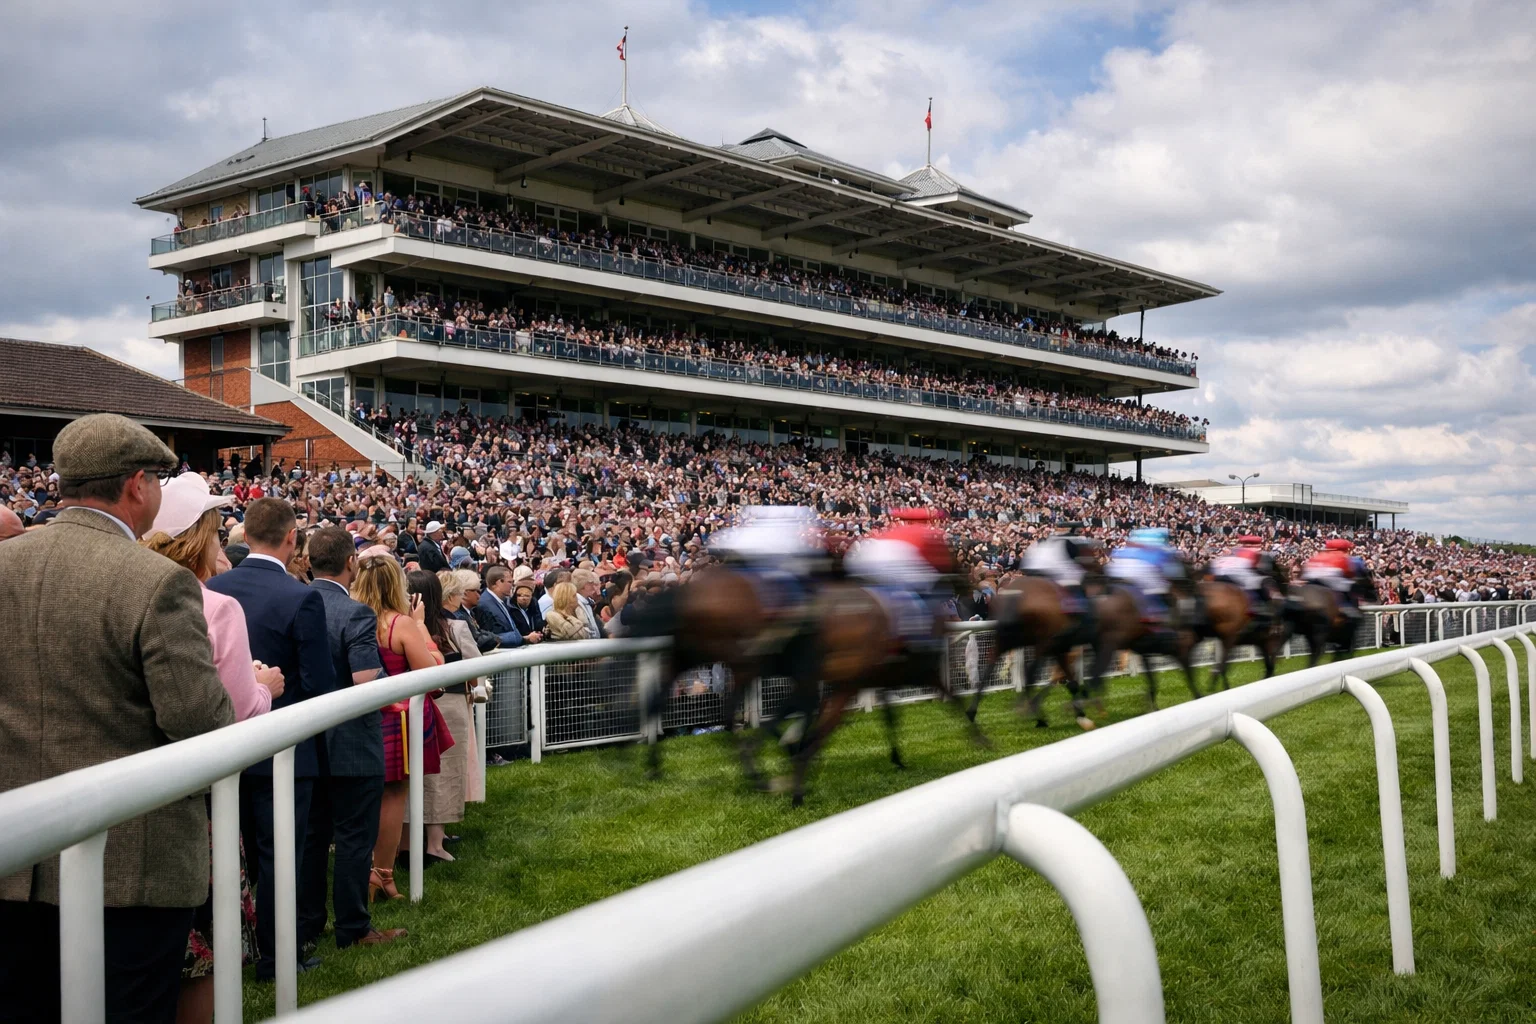
Attendance figures reveal public engagement with different venues. Saturday meetings average 6,480 spectators across 272 fixtures in 2024, with premier events like Royal Ascot and the Cheltenham Festival drawing vastly higher numbers. Weekday all-weather cards attract smaller crowds but generate substantial betting turnover from remote customers who never set foot on course. Results from a Tuesday evening at Wolverhampton carry less prestige than Saturday at York, yet both settle bets identically. Field sizes have improved at the top level, with Premier flat races averaging 10.95 runners in 2024—up from 10.62 the previous year—indicating competitive depth that makes results more meaningful for form analysis.
Course specialists appear regularly in results, horses whose records at particular venues exceed their general ability. Draw bias at certain tracks produces patterns that recur season after season, with results revealing statistical tendencies available to those who study them. Chester's inside draw advantage, Beverley's undulations, Goodwood's uniquely demanding contours—each course presents challenges that some horses master while others struggle.
The network's breadth ensures racing continues regardless of weather, season, or public appetite for any particular discipline. When turf frost abandons one meeting, all-weather alternatives proceed. When one code's season ends, another begins. Results flow continuously from this distributed infrastructure, 365 days a year, each outcome adding to the accumulated record of British racing performance.
Reading Results Like a Pro

Professional form students approach results systematically, extracting information that casual observers overlook. Learning to read results properly transforms raw data into usable intelligence, supporting better selections and deeper understanding of how races unfold. The process begins with knowing what to look for.
Finishing positions establish the basic hierarchy: first, second, third, and the remainder. But positions alone tell incomplete stories. A narrow second to a highly regarded winner differs fundamentally from a distant second to a moderate rival. Distances between finishers—expressed in lengths, short heads, heads, and necks—quantify margins. A head measures approximately a foot, a length roughly eight feet. These measurements, though imprecise, communicate competitive reality better than bare positions can.
Starting prices contextualise performance against expectation. A winner returned at 8/1 beat more fancied rivals, suggesting either improvement or market misjudgement. A 4/6 favourite justifying support confirms what money anticipated. Reading SP alongside finishing position reveals whether a result surprised the betting public or merely confirmed their assessment.
Official times appear for all British races, though their interpretation requires context. A time of 1:25.35 for seven furlongs means nothing without understanding the going description, the track's standard times, and weather conditions affecting the surface. Form publications compile standard times for each course and distance, allowing comparison between performances run on different days under different conditions. Adjusted times—sometimes called speed figures—translate raw clockings into comparable measurements.
Going descriptions accompany results and explain underfoot conditions. The scale runs from firm through good to firm, good, good to soft, soft, and heavy on turf, with standard and slow applicable to all-weather surfaces. Going affects times dramatically: heavy ground slows races considerably, while firm surfaces produce faster clockings. Reading going alongside time prevents mistaking surface conditions for ability.
Weight carried influences interpretation. Handicaps assign weights based on official ratings, attempting to equalise chances across different ability levels. A horse carrying 10 stone while narrowly defeating a rival carrying 9 stone performed commendably despite receiving no weight advantage. Weight-for-age scales apply in non-handicap races, accounting for younger horses' developmental stage against fully mature opposition.
Form figures preceding results compact recent history into shorthand notation. A figure of 1232 indicates first, second, third, then second in consecutive most recent starts. Dashes separate seasons; F indicates a fall in jump racing; P indicates pulled up. These compressed histories allow rapid assessment without consulting detailed records—though full form examination reveals nuance that shorthand cannot capture.
Jockey and trainer identities matter for pattern recognition. Certain trainers excel with particular horse types or at certain tracks; certain jockeys ride specific courses better than others. Results record connections because future selections benefit from understanding who produces consistent outcomes in comparable situations. The BHA's Horse Population Report records 13,556 horses currently in training across British yards—a population distributed among trainers whose strike rates vary considerably.
Headgear changes sometimes appear in results comments. First-time blinkers, cheekpieces, or visors suggest tactical experiments worth noting for future reference. Equipment changes occasionally coincide with improved performance, though equally often they precede continued disappointment.
Comments from reporters or in-running analysts sometimes accompany results, describing how races unfolded tactically. A horse prominent throughout differs from one switched off early before making late headway. These narratives help distinguish true ability from situational advantage, though they remain interpretive rather than definitive.
Reading results like a professional means integrating all available information rather than fixating on any single element. Position, margin, price, time, going, weight, connections, equipment—each contributes to the complete picture. Pattern recognition develops through repetition, as exposure to thousands of results builds intuition that supplements analytical technique.
The Industry Behind the Results
Every result that appears on your screen emerges from an industry employing tens of thousands of people across breeding operations, training yards, racecourses, and the broader commercial ecosystem supporting British racing. Understanding this context illuminates why results matter beyond individual bets—they represent the public-facing output of a significant national enterprise.
According to the TBA/PwC Economic Impact Study, British racing generates approximately £4 billion in gross value added to the British economy. The thoroughbred breeding industry alone contributes £375 million GVA, supporting around 21,000 jobs when direct and indirect employment are combined. These figures position racing as a substantial economic contributor, not merely a leisure pursuit with nostalgic appeal.
British racing's global standing reflects this economic weight. The same TBA/PwC study notes that 47 of the world's top-rated horses were trained in Great Britain in 2021, placing the nation third globally behind only the United States and Australia. Britain hosted 17 of the world's top-rated races that year, cementing its position as a premier destination for international competition. Results from these events carry implications well beyond domestic betting markets.
Employment spans diverse roles. The BHA has stated that approximately 85,000 jobs depend on British racing, from stable staff and work riders to racecourse personnel, breeding professionals, and the extensive network of veterinary, transport, and administrative services that racing requires. Results affect livelihoods: trainers whose horses win attract new owners; jockeys whose mounts perform accumulate riding fees and percentages; courses that stage successful events justify continued investment.
Funding flows through several channels. The Horserace Betting Levy Board Annual Report records levy income of £108.9 million in 2024/25—the fourth consecutive year of growth and the highest since levy reforms took effect in 2017. This statutory contribution from bookmakers funds prize money, raceday services, veterinary research, and welfare initiatives. The Board allocated £67 million to prize money during this period, directly enhancing the rewards available to connections when results go their way.
Total racecourse attendance reached 4,799,730 visitors in 2024, a modest 0.7% decline from the previous year. Betting turnover on British racing fell 6.8% in 2024 compared to 2023, reflecting broader shifts in gambling behaviour as risk-based affordability checks reshape how punters engage with the sport. Despite these headwinds, the levy yield increased—a pattern explained by improved margins for bookmakers even as overall volumes declined.
David Armstrong, CEO of the Racecourse Association, has characterised the attendance picture as encouraging despite broader economic headwinds. "2024's annual attendance figures demonstrate a year of consolidation, which is particularly encouraging considering the sport is in the midst of undertaking significant measures to enhance the product on offer," he stated. "Given the wider economic difficulties impacting households across the country, and the increased amounts of on-demand domestic entertainment, these figures give us cause for optimism. Horseracing is unique amongst major sports in that we attract customers looking for elite sport and a fantastic social occasion." This combination—sporting excellence with social appeal—distinguishes racing's proposition in an entertainment marketplace crowded with alternatives.
Welfare considerations increasingly influence how the industry presents itself. The HorsePWR platform publishes transparent statistics on equine fatalities, recording a 0.22% rate across all surfaces in 2025—192 horses from 86,300 individual runners. Jump racing carries higher inherent risk at 0.47%, while flat turf racing registers 0.10%. The industry has invested over £56 million in equine health and veterinary research since 2000, reflecting genuine commitment to minimising avoidable harm. Over 80% of British thoroughbreds remain active and identifiable after racing careers end, according to the industry census conducted via HorsePWR.
Brant Dunshea, CEO of the British Horseracing Authority, acknowledged challenges while pointing to progress. "The past year has seen growth in racecourse attendances, the success of the Axe The Racing Tax campaign, major initiatives to ensure more horses are raced and retained on our shores and continued improvements in horse and human welfare," he stated when addressing the sport's direction. Results reflect these efforts: better scheduling reduces clashes, improved welfare standards maintain public confidence, and investment in prize money attracts quality competition.
First-half attendance figures for 2025 showed 2,430,225 visitors across British racecourses, representing a 5.1% increase on the same period in 2024. This momentum suggests renewed public engagement with the sport's live offering, complementing the remote viewing and betting activity that generates most of racing's commercial return. Results serve both audiences—those present at the course experiencing outcomes in real time, and the larger population following remotely through digital platforms designed to deliver information within seconds of each finish.
The industry behind the results operates at scale, employs significantly, invests continuously, and faces genuine scrutiny on welfare and economic sustainability. Understanding this context helps appreciate why fast, accurate results matter: they are the visible product of an enterprise whose continuation depends on maintaining public engagement through quality information delivered without delay.
Frequently Asked Questions
What does SP mean in horse racing results?
SP stands for Starting Price, the official odds at which a horse began the race. These odds are determined by on-course bookmakers in the moments before the start and represent the consensus market price at that precise point. When you bet on a horse without taking fixed odds in advance, your returns are calculated using the SP. This figure matters considerably to British racing's betting economy: according to the Gambling Commission, horse racing generated £766.7 million in gross gaming yield from remote betting in 2024/25, with approximately 7% of British adults placing racing bets within any four-week period. The SP serves as the universal reference point for comparing prices across different betting platforms and for settling bets placed without specified odds. Higher SP numbers indicate longer odds (less fancied horses), while shorter prices reflect stronger market confidence. A winning bet on a horse returned at 10/1 SP pays ten times the stake plus return of the original stake, while a 4/5 favourite requires staking five pounds to win four.
How quickly are horse racing results updated?
Horse racing results typically appear within seconds of horses crossing the finishing line. This speed results from coordinated infrastructure involving racecourse officials, photo finish technology, timing systems, and data feeds that transmit outcomes to betting platforms and media outlets almost instantaneously. The British Horseracing Authority has deliberately improved scheduling to support faster result delivery: clashes between simultaneous races before 5pm have been reduced from 11.1% in 2022 to 5.8% in 2024. Fewer overlapping races mean clearer data pipelines and faster result publication. Delays occur when photo finishes require close examination, when stewards call enquiries to investigate potential rule infringements, or during technical difficulties affecting data transmission. Results declared subject to stewards' enquiry may subsequently change, so immediate results should be treated as provisional until confirmed. Weather-related abandonments and going changes can also affect result timing, as courses sometimes need to complete inspections or amend official conditions before finalising results.
What happens during a stewards' enquiry and can results change?
A stewards' enquiry is an official investigation called by racecourse stewards to examine potential rule infringements during a race. Enquiries may be called automatically by stipendiary stewards observing interference, or following objections lodged by jockeys who believe they were impeded. Results announced as subject to enquiry remain provisional until stewards reach their decision. The enquiry process involves reviewing patrol camera footage, interviewing jockeys, and assessing whether any interference affected finishing positions. Possible outcomes include the result standing unchanged, placings being amended, or horses being disqualified for causing interference. In severe cases of careless or dangerous riding, jockeys face bans affecting future mounts. The industry takes integrity seriously, with the BHA maintaining dedicated Intelligence services that monitor betting patterns alongside race-day stewardship. Results can change following enquiry, so bets should not be considered settled until the weighed-in announcement confirms placings as final. Most enquiries conclude within minutes of the race finishing, though complex incidents occasionally require longer deliberation.